
Introduction
Over the last several months I have been doing a bit of experimentation locally hosted LLMs, primarily with vLLM, llama.cpp, different quantization methods, GPU configurations, and models. My overall goal is a smart enough local agent that can code and troubleshoot, and ask smarter frontier models for help/review.
Part of this journey has been learning about all the tuning knobs. As knowing the api is responding is not really enough.
I also want to know things like:
- What model is actually loaded?
- How much VRAM is it consuming?
- How much VRAM do I still have available?
- Is the GPU actually doing anything?
- What context size am I running?
- How much KV cache is being consumed?
- What parameters did I start the inference engine with?
- How fast is the model actually responding?
Most of this information is available somewhere, but I wanted to not have to hunt and peck for data.
Normally, I would check Docker, query an API endpoint, run amd-smi (or nvidia-smi), look through vLLM startup logs, inspect environment variables, and then run another script just to benchmark the model. Not hard, but requires a few steps or maybe a script.
Instead, I built a dashboard.

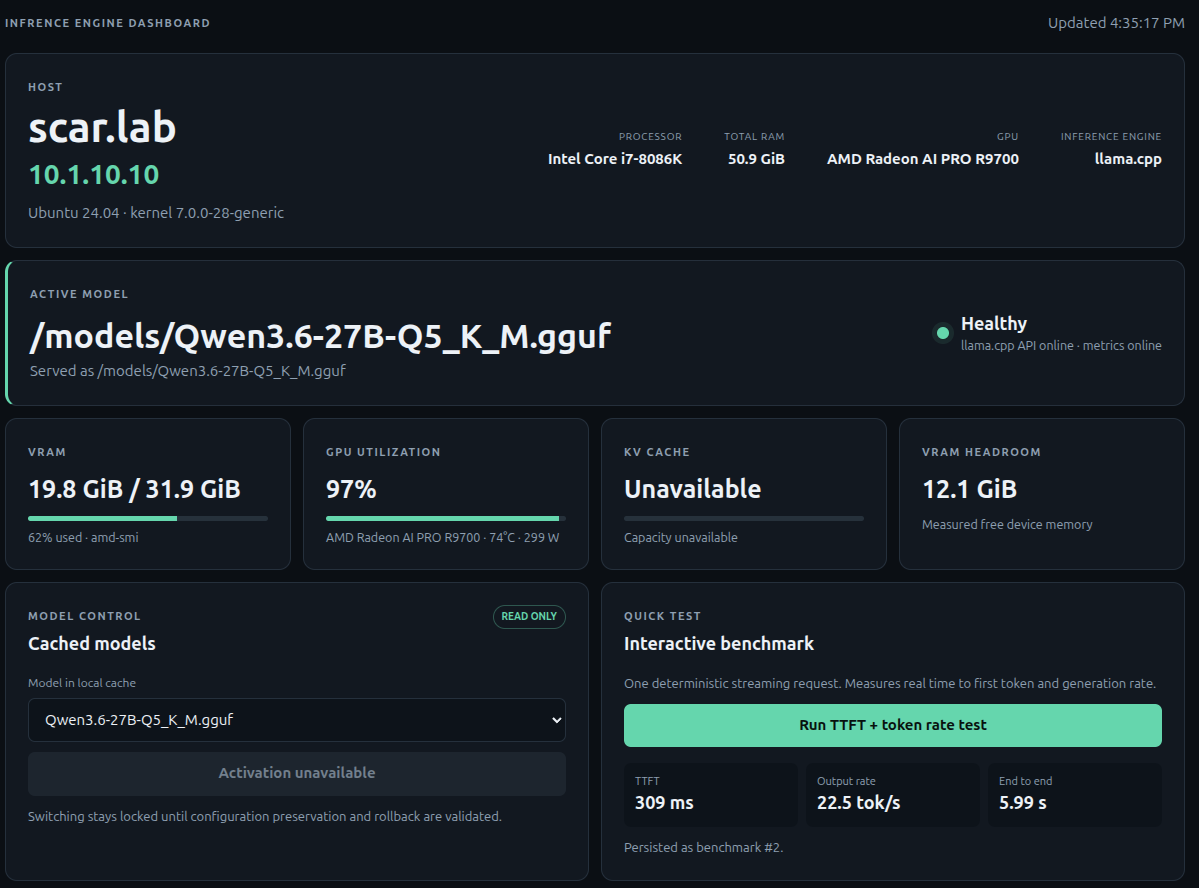
The project is called the Inference Engine Dashboard, and the goal is pretty simple: give me one place to see what my local inference server is doing.
This is not a proxy, or a chat engine. There are already plenty of those.
This is an operations and monitoring dashboard for vLLM and llama.cpp.

What I Wanted From the Dashboard
My primary use case is a workstation running a local LLM while I am also using the machine normally.
That makes VRAM particularly important, as I need to keep enough VRAM available if I want to fire up the desktop (DE).
For example, I may intentionally configure vLLM to use less than the maximum available GPU memory because I still need enough VRAM left for my desktop, browser, IDE, and other applications.
In that environment, I want to be able to open a webpage and immediately see something like:
- GPU: AMD Radeon AI PRO R9700
- VRAM used: 23 GB / 32 GB
- Inference process: 21 GB
- Other GPU applications: 2 GB
- Remaining headroom: 9 GB
- Model: Qwen
- Context: 32K
- KV cache utilization
- GPU utilization
- GPU temperature
- Current token throughput
Basically, the things I normally end up checking manually.
Local-First Architecture
I deliberately designed the dashboard to run on the same physical machine as the inference engine as some information is easy to get remotely from the vLLM or llama.cpp API, but detailed hardware and process information is not.
To accurately determine what is happening on the host, the dashboard may need access to:
- GPU devices
- GPU process information
- Docker container metadata
- Inference process IDs
- ROCm libraries
- Model cache directories
- Host CPU and memory information
The application itself runs using Docker Compose.
docker compose ps
I also did not want to simply give the application unrestricted access to /var/run/docker.sock, so Docker access is provided through a restricted Docker socket proxy.
Model caches and other host resources are mounted read-only wherever possible.
That was an important design decision because eventually I may allow the dashboard to manage inference engines, but I don’t want to jump directly from “monitoring dashboard” to “application that can arbitrarily manipulate containers.”
Current Dashboard Information
The main dashboard provides a quick overview of the host and inference environment.
It includes information such as:
Host
- Hostname
- IP address
- Operating system
- Kernel
- CPU
- Total system memory
GPU
- GPU model
- GPU utilization
- Temperature
- Power consumption
- VRAM used
- VRAM available
- Inference-process VRAM
- Other GPU process usage
Inference Engine
- Active model
- Backend
- API health
- Metrics health
- Maximum context
- KV-cache utilization
- Current throughput
- Runtime configuration
The dashboard also displays locally cached models so I can see what is already available on the host.
If the inference engine or GPU tooling doesn’t expose a particular value, the dashboard displays it as unavailable rather than trying to estimate it.
Monitoring vLLM
vLLM exposes quite a bit of useful information, but it isn’t all available from one location.
The dashboard therefore combines information from several sources, including:
/health/v1/models/metrics
along with:
- Docker inspection
- Container environment variables
- vLLM startup logs
- GPU process telemetry
From those sources the dashboard can display information including:
- Active model
- Served model name
- vLLM version
- Container image
- Maximum model length
- GPU memory utilization target
- Precision
- Quantization
- Maximum sequences
- Maximum batched tokens
- Prefix caching
- KV-cache type
- KV-cache allocation
- KV-cache utilization
- KV-cache token capacity
- CPU offload
- Swap configuration
- Maximum concurrency
- Prompt throughput
- Output throughput
- Model-weight VRAM
- Inference-process VRAM
- Other GPU VRAM usage
- Remaining VRAM headroom
Some of the more detailed memory information is only available in the vLLM startup logs.
This is another reason the dashboard runs locally.
If vLLM doesn’t provide enough information to reliably calculate a value, the dashboard simply reports it as unavailable.
Monitoring llama.cpp
One of the more interesting parts of the project was adding llama.cpp support as llama.cpp and vLLM expose very different information.
My first thought was to simply use the same dashboard fields and populate whatever llama.cpp could provide.
That quickly resulted in a screen containing a whole bunch of:
N/AN/AN/AN/A
which isn’t particularly useful.
So the dashboard now uses provider-specific runtime views.
For llama.cpp it queries endpoints including:
/health/v1/models/props/metrics/v1/completions
Depending on what the server exposes, the llama.cpp runtime panel can display:
- Active GGUF model
- Configured context window
- Native model context window
- GGUF quantization
- Model parameter count
- Model file size
- Parallel slots
- GPU layers
- Batch size
- Microbatch size
- Temperature
- Top-K
- Top-P
- Min-P
- Repeat penalty
- llama.cpp build version
- Container image
- Token throughput
- Inference-process GPU memory
This makes the llama.cpp view much more useful than trying to force llama.cpp into a vLLM-shaped dashboard.
GGUF Model Discovery
The dashboard can also scan a configured directory containing GGUF models.
For example:
/models
or wherever your llama.cpp model library happens to live.
The directory is mounted read-only into the dashboard container and any discovered GGUF files are displayed in the model selector.
At the moment this is informational.
The dashboard can see the models, but it cannot switch to them yet.
That is intentional.
AMD GPU Monitoring
My current workstation uses an AMD GPU, so ROCm support was a requirement from the beginning.
On AMD systems the dashboard primarily uses:
amd-smi
with ROCm SMI available as a fallback.
In addition to total GPU memory consumption, I wanted to know who was using the VRAM.
That allows the dashboard to distinguish between:
Inference ProcessOther GPU ProcessesUnattributed GPU MemoryFree VRAM
This is particularly useful on a workstation.
If my inference engine is configured to consume around 23 GB of a 32 GB GPU, I want to know whether the remaining GPU memory is actually available or whether Chrome, my desktop environment, an IDE, or something else has already consumed part of it.
The Interactive Benchmark
I also wanted a quick way to test a model after changing its configuration. Wasn’t looking for a massive benchmark suite.
Just something that answers:
“Does this model actually feel fast when I interact with it?“
The dashboard includes a:
Run TTFT + token rate test button.
The benchmark sends a deterministic streaming request through the OpenAI-compatible endpoint.
/v1/completions
The current test uses:
Temperature: 0Seed: 1Maximum output: 128 tokensConcurrency: 1Warm-up requests: 0
The test records three values that I care about for interactive use.
Time to First Token
How long did I wait before the model actually started responding?
Output Tokens Per Second
Once generation started, how quickly did the model generate tokens?
End-to-End Latency
How long did the complete request take?
The benchmark results are stored in SQLite along with information including:
- Model
- Prompt tokens
- Completion tokens
- Seed
- Time to first token
- Generation time
- End-to-end latency
- Output tokens/sec
- Raw streaming evidence
That means I can start building some history as I experiment with different models and runtime settings.
What This Benchmark Is Not
The built-in benchmark is intended as a quick interactive performance test.It is not intended to replace a proper inference benchmarking suite.
Currently it does not test:
- Multiple simultaneous users
- P50/P95/P99 latency
- Long-context performance
- Sustained GPU utilization
- Warm versus cold requests
- Maximum batch throughput
- Extended resource sampling
Those are all things I may eventually add.
For now I mainly want to answer:
I changed something. Did the model get faster or slower?
For that, the test works pretty well.
Deployment
Deployment is intentionally simple.
Clone the repository, configure the environment, and run:
./scripts/deploy.sh
Host-specific settings are stored in a gitignored:
.env
file.
The same dashboard can be configured for either inference engine by setting:
INFERENCE_BACKEND=vllm
or:
INFERENCE_BACKEND=llama_cpp
and providing the appropriate API endpoint and model-cache location.
The containers use Docker’s:
unless-stopped
restart policy, so the dashboard will come back automatically after the host reboots and Docker starts.
Why Model Switching Is Disabled
You may notice that the dashboard can discover models but currently doesn’t allow you to activate one.
This is intentional.
It would actually be fairly easy to add a button that stops an inference container and starts another model.
The problem is everything that can happen after I push that button.
For example:
- Stop the running inference engine.
- Start the new model.
- Model doesn’t fit in VRAM.
- Container crashes.
- API never becomes healthy.
- Previous configuration is now gone.
- My inference server is offline.
Not particularly useful.
Before enabling model switching I want the application to support something closer to a transaction:
Save current configuration ↓Stop current model ↓Start requested model ↓Validate container ↓Validate API ↓Validate model ↓SUCCESS
If something fails:
FAIL ↓Restore previous configuration ↓Restart previous model ↓Validate health
Once that logic exists, enabling lifecycle controls makes much more sense.
Security
Authentication is also not implemented yet.
So at this point the dashboard should only be exposed on a trusted network.
That is less concerning while the application is primarily read-only, but it becomes much more important once lifecycle controls are introduced.
Before enabling model switching or container management I plan to add authentication and additional authorization controls.
Why I Built It
This really came out of repeatedly doing the same troubleshooting process.
I would SSH into the workstation and run something like:
docker ps
Then:
amd-smi
Then:
curl http://localhost:8000/v1/models
Then:
curl http://localhost:8000/metrics
Then look through the container logs:
docker logs <container>
Then maybe run another script to see how fast the model was responding.
None of those things are particularly difficult.
It is just a lot of little pieces of information spread across several different tools.
Now I can open one page and immediately see:
- What model is running
- Whether the inference server is healthy
- How much VRAM it is consuming
- What else is using the GPU
- How much VRAM I have left
- What context size is configured
- How much KV cache is being used
- How the inference engine was configured
- How quickly the model starts responding
- How many tokens/sec it is generating
Which is basically what I wanted.
What’s Next
There are several things I would eventually like to add.
The big one is obviously safe model switching.
Beyond that I would like to explore:
- Model configuration profiles
- Transactional model switching
- Automatic rollback
- Authentication
- Historical GPU metrics
- Historical VRAM consumption
- Benchmark history and comparison charts
- Longer-context benchmarks
- Concurrent request testing
- NVIDIA GPU support
- Additional inference engines
There is also an interesting possibility of having the dashboard recommend runtime settings based on available GPU memory and the selected model.
But I don’t want this to become another giant AI management platform.
The original goal is still the most important one:
Open one page and understand what my local inference server is doing.
So far, it has made experimenting with vLLM and llama.cpp considerably easier.
Resources
- Project Repository
https://github.com/christopherpaquin/vLLM-Llama.ccp-Dashboard - vLLM
https://github.com/vllm-project/vllm - llama.cpp
https://github.com/ggml-org/llama.cpp