Category: Misc

  • The July 2026 Agentic Coding Cheat Sheet: Frontier Tools, Cost Models, and Quota Mechanics – V2

    The July 2026 Agentic Coding Cheat Sheet: Frontier Tools, Cost Models, and Quota Mechanics – V2

    The tool sprawl in AI engineering has officially outrun our collective memory, at least it has mine.

    Between native terminal agents, newly minted desktop clients, and entirely divergent API cost models, keeping the ecosystem straight is a full-time job.

    I built this reference guide for a very simple reason: I needed a single, no-nonsense source of truth to track what tools each frontier provider actually offers right now, and exactly how running autonomous developer loops will affect my wallet.

    Here is the state of the stack as I know it and use it. Sure there are plenty of options I am missing.


    The Tooling Matrix: Interfaces, CLIs, and IDEs

    This matrix maps out exactly where each provider expects you to interact with their models, highlighting the shift toward dedicated desktop environments and autonomous terminal agents.

    Provider / EcosystemFlagship Web / Workspace InterfaceOfficial Desktop AppNative CLI / Terminal AgentIDE Integration Strategy
    GitHub CopilotGitHub.com & Copilot Workspace (Issue-to-PR sandbox)GitHub Copilot App (Native agent-centric control center)GitHub Copilot CLI (TUI via gh copilot with local execution capabilities)Official Extension (VS Code, JetBrains, Visual Studio, Neovim)
    Anthropic (Claude)Claude.ai (with Artifacts for rendering code/UI side-by-side)Claude Desktop App (Supports local filesystem/tool execution)Claude Code (State-of-the-art terminal agent for codebase refactoring)No official extension; relies on CLI or third-party tools like Cline/Continue
    OpenAI (ChatGPT)ChatGPT (utilizes Canvas for inline text and code editing)ChatGPT Desktop App (Mac & Windows)OpenAI API CLI (Primarily for asset, file, and model management)No direct IDE tool; serves as the model layer for Cursor, Aider, etc.
    Google (Gemini)Gemini Web InterfaceAntigravity 2.0 Desktop ClientAntigravity CLI (Replaces old gemini-cli; orchestrates parallel agent tasks)Gemini Code Assist & Antigravity plugins (VS Code, Android Studio, IntelliJ)
    DeepSeekDeepSeek Chat (V3 & R1 reasoning models)Mobile Apps (Relies on web wrappers for desktop)None natively (Relies on community tools like Ollama or Aider)Native integration into open-source extensions like Continue and Cline
    PerplexityPerplexity.ai (Pro search & “Pages” workspace)Perplexity Desktop (Mac & Windows)None (Relies on API keys for third-party scripts)None (Primarily used as a data-grounding search API)

    The Economic Matrix: Quotas, Costs, and Loop Behavior

    This is the most critical matrix, IMHO. As someone who is experimenting with numerous paid frontier model services, each with a limited budge, I am not all in on any service yet, and want to maximize my low-paid token tiers.

    This table explains how the subscription models and APIs.

    Provider / ServiceDeveloper Plan & Cost (USD)IDE / CLI Billing MechanismQuota / Rate Limit MechanicsThe “Agentic Loop” Behavior (The Cost Trap)
    GitHub CopilotPro: $10/mo
    Max: $100/mo
    Flat-rate subscription for native tools.Hybrid Metered: Unlimited standard completions + a fixed pool of premium model credits.The Safest Route: Because it’s integrated, Microsoft absorbs a massive amount of the token cost, but heavy loop usage will hit a speed throttle unless on the Max tier.
    Anthropic (Claude)Pro: $20/mo
    Max 5x: $100/mo
    Billed via web account or separate Pay-As-You-Go API.5-Hour Rolling Window: Dynamic usage budget that resets every 5 hours based on server demand.High Risk for Pro: Running Claude Code on a large infrastructure repository will hit your 5-hour limit fast. Full-time agentic workflows require switching to Claude Max or the raw API.
    OpenAI (ChatGPT)API Account
    (Pay-As-You-Go)
    BYOK (Bring Your Own Key): Paid per token used in Cursor, Aider, etc.Volumetric Tiers: Limits depend on lifetime account funding (Tiers 1–5), scaling from 200k to millions of tokens/min.Predictable but Costly: Perfect for episodic troubleshooting, but an out-of-control recursive autonomous loop can easily rack up a $20–$50 bill in an afternoon.
    Google (Gemini)Code Assist Standard
    ~$19/mo
    Flat-rate per user or metered hourly via Google Cloud.Concurrently Throttled: Throttles users if background parallel multi-agent loops request too much compute at once.Great for Standard Dev: Highly stable for individual coding, but hard to hook into un-vetted, third-party autonomous command-line tools.
    DeepSeekPlatform API
    (Pay-As-You-Go)
    BYOK: Funded via a pre-paid developer wallet.Wallet Funded: Strictly bound by whatever dollar amount you load into your account.The Economy Champion: Because of their unified architecture and heavy 90%+ prompt caching discounts, running heavy agentic loops costs literal pennies compared to western models. $10 can last a month.
    PerplexityPerplexity Pro
    $20/mo
    Subscription includes a small monthly API credit.Fixed Credit Ceiling: API access stops or charges your card when your small monthly search token allowance runs dry.Not For Coding Loops: Great for pulling real-time documentation or API schemas into your agent, but financially unviable for writing or refactoring code blocks.

    Understanding the Layers of Agentic LLM Tool Execution

    To expand this post, it is useful to define several concepts that are now common in agentic AI systems: tools, skills, MCP servers, local execution layers, and IDE-integrated actions.

    Out of the box, an LLM is primarily a reasoning and text-generation system. You can ask it questions, request explanations, have it draft a script, or ask it to review configuration, and it will respond with generated text. By itself, however, the model does not inherently have access to your operating system, local files, terminal, IDE, logs, repositories, ticketing systems, monitoring platforms, or infrastructure.

    That distinction is important.

    A hosted model may appear to have additional capabilities, such as reading uploaded documents, searching the web, generating files, or analyzing code, but those capabilities are usually provided by the surrounding platform, client application, or agent runtime rather than by the model alone.

    This is where concepts such as tools, skills, MCP servers, and agent runtimes become important. These components extend an LLM from a passive chatbot into an interactive agentic system. The model can reason about what needs to happen, request the appropriate tool, inspect the result, and continue working through a task. The runtime around the model is responsible for exposing those tools, enforcing policy, executing approved actions, and returning results back to the model.

    When discussing LLMs that can inspect logs, modify files, run scripts, query systems, or interact with development environments, it is important to separate the layers involved. These capabilities are often described broadly as “agentic AI,” but agentic behavior is usually the result of several distinct components working together.

    The model provides reasoning and structured tool-call requests. The orchestration layer manages the workflow, state, prompts, and tool-calling loop. The local execution layer performs approved actions against the operating system, filesystem, terminal, repository, or other target environment. IDE-integrated actions expose workspace-specific capabilities such as file editing, diagnostics, Git state, and terminal access. Skills provide reusable task-specific instructions or workflows. MCP servers provide a standardized way to expose tools, resources, and prompts to compatible AI clients.

    In other words, the LLM is tool-aware, but the surrounding runtime is tool-authoritative.

    The model may decide that it needs to read a log file, edit a configuration file, run a script, or inspect a repository. However, the runtime determines which tools exist, which actions are allowed, where those actions execute, what policy controls apply, and what results are returned to the model.

    The table below provides a high-level comparison of the major concepts involved in LLM-driven local execution and tool integration.

    LLM Agent Execution Layers and Integration Concepts

    ConceptFormal NameWhat It MeansWhat It Controls or ProvidesExample in Practice
    Tool callingTool calling / function calling / structured tool invocationThe model’s ability to request an external action using a defined schema instead of free-form text.Provides the structured interface between the LLM and external capabilities.The model requests read_file(path="/var/log/app.log") or run_tests(command="pytest").
    ToolAgent tool / callable tool / local execution toolA specific function or action that can be invoked by the agent workflow.Provides a single capability, such as reading a file, tailing logs, running a script, or checking Git status.tail_log, write_file, run_shell, git_diff, restart_service.
    AgentLLM agent / tool-using agent / agentic workflowThe loop that allows the model to plan, call tools, observe results, and continue until the task is complete.Coordinates reasoning, tool requests, observations, and final responses.The agent reads an error log, edits a config file, restarts a service, checks the result, and reports back.
    Agent orchestration frameworkAgent framework / workflow orchestration frameworkA framework used to build and manage the agent loop, tools, prompts, state, and execution flow.Provides abstractions for models, prompts, tools, memory, state, routing, and workflow control.LangChain, LangGraph, Semantic Kernel, AutoGen, CrewAI.
    Local execution layerGoverned local execution layer / OS execution layer / tool execution runtimeThe runtime component that actually performs approved actions against the local operating system or workspace.Controls OS-level access, command execution, filesystem changes, script execution, and result capture.Running journalctl, editing a YAML file, executing a validation script, or applying a patch.
    IDE-local actionsIDE agent tools / workspace tools / editor-integrated actionsTool capabilities provided inside an IDE or local coding assistant environment.Gives the agent access to files, terminals, diagnostics, search, Git state, and editor context within a workspace.Cursor, Cline, Continue, Zed, VS Code Chat, Aider, OpenHands.
    SkillsAgent skills / repo-local skills / workflow skillsPackaged instructions, scripts, conventions, or workflows that teach an agent how to perform a specific task in a specific context.Provides repeatable task guidance and project-specific operating instructions.A repo skill that tells the agent how to validate changes using shellcheck, pytest, yamllint, and ./health-check.sh.
    MCPModel Context Protocol / MCP server / MCP tool / MCP resourceA standard protocol for exposing tools, resources, and prompts to compatible AI clients.Standardizes how external systems provide capabilities and context to AI applications.An MCP server exposes filesystem access, GitHub issues, database queries, lab inventory, or monitoring data.
    Policy and guardrailsExecution policy / tool governance / approval policyThe rules that determine what tools are available, what actions are allowed, and whether approval is required.Controls access boundaries, command restrictions, file path restrictions, approval gates, logging, and auditability.Allow reading logs but require approval before modifying /etc/ or restarting a service.
    Observability and audit trailAgent observability / execution logging / audit trailThe record of what the agent requested, what was approved, what was executed, and what changed.Provides troubleshooting, reviewability, compliance, and rollback support.Logging each tool call, command output, file diff, approval decision, and final result.
  • From Phrasing to Choreography: An Exceptionally Brief History of Agentic Coding

    From Phrasing to Choreography: An Exceptionally Brief History of Agentic Coding

    The future is now… which is now “then.”

    Do you remember where you were on November 30th, 2022. If you were in the US (or perhaps Liberia or parts of Mexico as I have recently come to learn), you may have been sitting around the house eating leftover turkey, or a nice ham sandwich (if you were fortunate to have both available on Thanksgiving).

    November 30th, 2022 was the launch date for ChatGPT.

    Although it was very rough around the edges and not ready for prime-time, many immediately saw into the future. I cannot say that I did immediately, but I was out there experimenting, watching it “lie” to me. Those “lies” were quickly labeled hallucinations and sounded much cooler. Anyway the race was on apparently. Not that I was fully paying attention at the time.

    Like most engineers across infrastructure, hardware, or software, I’ve spent the last four years just trying to keep my head above water. Figuring out what to learn and what to ignore has become almost as exhausting as the actual learning process. On one side, you have the performative hype from influencers desperate to prove how far ahead of the curve they are. On the other, there’s a deafening wall of noise from frontier model providers and newly christened startups, all frantically trying to dump a product before their razor-thin window of entrepreneurship slams shut.

    As a traditional infra-engineer, LLMs and agentic coding have been quick to deliver value. I have never identified as a software engineer, but rather a hardware and infra-centric practitioner. I’ve spent my work-life architecting, deploying, and supporting Unix/Linux, virtualization platforms, and enabling hardware functions such as SR-IOV for Telcos across North America.

    I’m the guy who knows the difference between raid 0+5 and 5+0.

    Suddenly, I am now a technologist who now has the tools to quickly deliver true infrastructure as code without having to become an evangelist for any specific automation platform. Suddenly, its much easier to deploy tools, supporting services, create dashboards, and troubleshoot and resolve system/hardware issues.

    Strangely I have always loved creating documentation, and have spent many years being frustrated with the lack of documentation that I have seen from others. To me, a measure of success is the fact that a solution that you built, is still relied upon once you are gone. Without proper documentation, and the ability for your successors to truly understand, operate, and enhance something that you built is dependent on great documentation. If you can not transfer the appropriate level of operational and design knowledge to those who replace you, they will replace your solution as well. With AI, everyone now has the power of documentation. “Review this repo and describe how it works, update the README.md”. It’s truly a wonderful thing.

    The Micro-Eras of Agentic Coding

    Having done my best to keep up via reading, experimenting, and building, I have learned quite a bit in a very short time. Those who share the same passions and beyond are often learning the same things at the same time. Separately, but also together, as they uniformly change the vernacular of agentic coding. First, we learn how to prompt from the perspective of a persona, defining outcomes. Next, we discover the need for guardrails and frameworks, especially when the word security rears its ugly head.

    Nothing below is unique or original, and I am not sure that there is actually a difference between 3 & 4, or possibly the Eras are in the wrong order, but here is my table for trying to keep straight concepts and terminologies that describe those contexts

    Era & FocusThe Primary Problem SolvedThe Technical Stumbling BlockThe AI Engineer’s Job
    1. Prompt Engineering
    (2022-2023)
    Expression: Shaping the tone, persona, and output formatting of the LLM.Hallucinations: Cannot conjure up data or facts it wasn’t trained on.Writing clear, contextual instructions and few-shot examples.
    2. Context Engineering
    (2023-2024)
    Information: Injecting real-time, proprietary data via RAG and Vector DBs.Passivity: The model can read your data, but cannot act on it or use tools.Managing token budgets, chunking data, and optimizing semantic retrieval.
    3. Harness Engineering
    (2024-2025)
    Environment: Giving the model tools, secure sandboxes, and safety guardrails.Rigidity: Linear chains break completely when the model makes a minor mistake.Building secure execution environments, MCP servers, and input/output parsers.
    4. Loop Engineering
    (2025-2026)
    Autonomy: Letting the system evaluate, self-correct, and iterate recursively.Compute Cost: High token consumption due to repetitive agent cycles.Designing state machines, testable termination conditions, and exit criteria.

    “It’s all vibecoding, right”

    The term “vibe-coding” was officially coined by Andrej Karpathy (former Director of AI at Tesla and co-founder of OpenAI) in a viral post on X (Twitter) on February 8, 2025.

    And it’s a term that I despise, despite fully understanding how fitting that term was at the time.

    Fast forward 1.5 years, and now “vibe-coding” sounds silly and very passe, as to me it implies sitting down with a chat window and an idea, and nothing more. This is what kids do in the basement to build a fun yet forgettable android game, right?

    And this is not where we are today. Today we are knee-deep in learning, and imagining what the next step is in this agentic evolution.

    Planning, context, guardrails, loops, governance, frameworks, and harnesses is where we are, at least mainly in theory, and sometimes in practice.

  • How to Reconfigure Claude Code CLI when changing subscriptions

    How to Reconfigure Claude Code CLI when changing subscriptions

    My employer recently put the kibosh on personal home lab usage.

    No longer can employees who have invested time and money into building out a lab to learn and test our own products utilize their home lab to connect to any internal tool or service. You can not even access your work gmail on anything other than your company provided workstation or your monitored phone.

    Which apparently means that I can no longer use my work provided Claude code account from a non-company supplied workstation, as its a company provided tool.

    This was my original workflow

    A flowchart illustrating a software development process with five steps: starting with a laptop labeled 'Claude/Cursor', followed by 'Test & Deploy in Home Lab', then 'Fix Bugs and Secure', next 'Commit', and finally 'Clone Repo to Work Env'.

    Now my choices are to either “Test & Deploy on Company Hardware” or utilize my own subscriptions and do my initial development on whatever workstation I happen to be in front of at the time. I chose the latter, as I want to establish my own agentic workflows that are not dependent on employer provided subscriptions, and I want to utilize my own hardware without having to deal with hardware resource scheduling.

    So that takes us to where we are today.

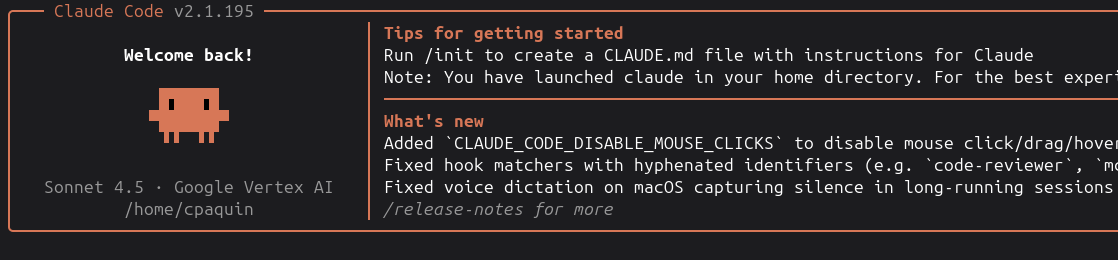
    A broken Claude Code CLI, that fails to authenticate as my initial corp provided config seems to be pervasive across multiple env vars and conf files. So lets clean that up.

    Screenshot of a terminal interface displaying welcome message for Claude Code v2.1.195, with tips for getting started and recent updates.

    First step is to remove any env vars you find in the files below

    grep -rE "CLAUDE_CODE_USE_VERTEX|ANTHROPIC_VERTEX_PROJECT_ID|CLOUD_ML_REGION|VERTEX|vertex" \
    ~/.bashrc \
    ~/.zshrc \
    ~/.bash_profile \
    ~/.profile \
    ~/.config/environment.d/* \
    /etc/environment \
    /etc/profile.d/* \
    ~/.claude/settings.json \
    ~/.claude/settings.local.json \
    2>/dev/null

    We must go deeper.

    find ~ -maxdepth 3 -name ".env" 2>/dev/null | xargs grep -l -iE "vertex|CLAUDE_CODE" 2>/dev/null

    Any vars found here, delete.

    Let’s make sure I cleaned up all shell vars. If you find any – unset them. Then source your .bashrc to make sure they are not set there on login.

    env | grep -iE "vertex|gcloud|google|claude|anthropic"
    PWD=/home/cpaquin/.claude

    Same with claude logging, we can check the latest debug log and look for errors around a broken config (use /debug to enable).

    cat ~/.claude/debug/latest

    Once you have removed any detritus from your config/env simply re-launch Claude and authenticate via your method of choice.

    Login screen for Claude Code with options for account types: Claude account with subscription, Anthropic Console account, and 3rd-party platform.

  • RHEL 10 – Enable Health Monitoring for NVIDIA GPUs Using DCGM Exporter

    RHEL 10 – Enable Health Monitoring for NVIDIA GPUs Using DCGM Exporter

    Nvidia Datacenter GPU Manager (DCGM) is a suite of tools that provides health monitoring, performance telemetry, and proactive diagnostics for NVIDIA GPUs deployed on bare-metal servers. It is mainly installed for managing a fleet of GPUs across a large number of GPU enabled nodes.

    DCGM does not have a WebUI, and is often seen “exporting” metrics into Grafana or other enterprise observability tools (like Zabbix) via Prometheus Scrape. I have both Grafana and Zabbix in my lab environment so I have a couple of options to where I want to visualize the data.

    In this post, we are going to …

    • Validate GPU Host Setup
    • Install Nvidia DCGM
    • Enable Health Watches via DCGM
    • Setup dcgm-exporter for exporting of GPU metrics

    Nvidia Drivers Install on RHEL 10.1

    A lot has changed in RHEL 10.1 regarding the installation of NVIDIA drivers on RHEL 10. You can now install them via rhel-drivers.

    The post below is pretty throughout on the topic
    https://www.redhat.com/en/blog/introducing-new-and-simplified-ai-accelerator-driver-experience-rhel

    Since I already have the NVIDIA drivers installed on my two GPU enabled nodes, I will just confirm they are both running the same driver version (for consistency) and will ensure the driver is loading properly with nvidia-smi. I will also install CUDA and the nvidia-container-toolkit.


    Host Validation

    In my lab I have 2x Dell R730s with Nvidia Tesla T4s installed (Turing-class GPUs). They are not the most modern GPUs but they are Data center class, can be purchased pretty cheaply used, and only draw ~70w of power and therefore do not require any additional power connections from a riser card or the system board.

    So on each host we will first start off by insuring we have the proper NVIDIA drivers installed.

    [root@columbia ~]# rhel-drivers list
    Available drivers:
    amdgpu:latest
    > nvidia:590.48.01

    Now we run “nvidia-smi” to confirm the driver is loaded and the GPU is recognized.

    nvidia-smi
    Tue Feb 24 10:49:29 2026
    +-----------------------------------------------------------------------------------------+
    | NVIDIA-SMI 580.105.08 Driver Version: 580.105.08 CUDA Version: 13.0 |
    +-----------------------------------------+------------------------+----------------------+
    | GPU Name Persistence-M | Bus-Id Disp.A | Volatile Uncorr. ECC |
    | Fan Temp Perf Pwr:Usage/Cap | Memory-Usage | GPU-Util Compute M. |
    | | | MIG M. |
    |=========================================+========================+======================|
    | 0 Tesla T4 Off | 00000000:04:00.0 Off | 0 |
    | N/A 34C P8 13W / 70W | 0MiB / 15360MiB | 0% Default |
    | | | N/A |
    +-----------------------------------------+------------------------+----------------------+

    Moving on 2 our second host and verify the installed driver.

    [root@prometheus ~]$ rhel-drivers list
    Available drivers:
    amdgpu:latest
    *> nvidia:590.48.01

    And nvidia-smi output, we can see that there are two Telsa T4s in this machine. Nice!

    [root@prometheus ~]$ nvidia-smi
    Tue Feb 24 10:52:55 2026
    +-----------------------------------------------------------------------------------------+
    | NVIDIA-SMI 590.48.01 Driver Version: 590.48.01 CUDA Version: 13.1 |
    +-----------------------------------------+------------------------+----------------------+
    | GPU Name Persistence-M | Bus-Id Disp.A | Volatile Uncorr. ECC |
    | Fan Temp Perf Pwr:Usage/Cap | Memory-Usage | GPU-Util Compute M. |
    | | | MIG M. |
    |=========================================+========================+======================|
    | 0 Tesla T4 Off | 00000000:04:00.0 Off | 0 |
    | N/A 30C P8 9W / 70W | 0MiB / 15360MiB | 0% Default |
    | | | N/A |
    +-----------------------------------------+------------------------+----------------------+
    | 1 Tesla T4 Off | 00000000:06:00.0 Off | 0 |
    | N/A 32C P8 9W / 70W | 0MiB / 15360MiB | 0% Default |
    | | | N/A |
    +-----------------------------------------+------------------------+----------------------+

    Lets also make sure that we have the same CUDA version installed across hosts.

    [root@prometheus ~]$ rpm -qa | grep cuda-toolkit
    cuda-toolkit-config-common-13.1.80-1.noarch
    cuda-toolkit-13-config-common-13.1.80-1.noarch
    cuda-toolkit-13-1-config-common-13.1.80-1.noarch
    cuda-toolkit-13-1-13.1.1-1.x86_64
    cuda-toolkit-13.1.1-1.x86_64

    We also need to update $PATH for nvcc if we have not done so already.

    cat << 'EOF' | sudo tee /etc/profile.d/cuda.sh
    export PATH=/usr/local/cuda/bin:$PATH
    export LD_LIBRARY_PATH=/usr/local/cuda/lib64:$LD_LIBRARY_PATH
    EOF

    Then source the path.

    # source /etc/profile.d/cuda.sh

    And now run nvcc.

    nvcc --version
    nvcc: NVIDIA (R) Cuda compiler driver
    Copyright (c) 2005-2025 NVIDIA Corporation
    Built on Tue_Dec_16_07:23:41_PM_PST_2025
    Cuda compilation tools, release 13.1, V13.1.115
    Build cuda_13.1.r13.1/compiler.37061995_0

    We also will need to install the Nvidia Container Toolkit on both GPU hosts, using the RHEL 9 version below.

    sudo dnf config-manager \
    --add-repo=https://nvidia.github.io/libnvidia-container/stable/rpm/nvidia-container-toolkit.repo

    Once again we are going to skip the gpgcheck. Again this is a homelab.

    sudo dnf install -y --nogpgcheck nvidia-container-toolkit

    And now we validate install on both hosts.

    # nvidia-ctk --version
    NVIDIA Container Toolkit CLI version 1.18.2
    commit: 9e88ed39710fd94c7e49fbb26d96492c45e574fb

    Now we need to generate the CDI specification, as Podman does not use Docker-style run-times, and instead using Container Device Interface (CDI).

    sudo nvidia-ctk cdi generate --output=/etc/cdi/nvidia.yaml

    The command above creates /etc/cdi/nvidia.yaml which describes installed GPUs and NVML libraries.
    We now need to restart podman and confirm podman sees our CDI devices.

    cat <<'EOF' | sudo tee /etc/containers/containers.conf.d/99-cdi.conf
    [engine]
    cdi_enabled=true
    cdi_spec_dirs=["/etc/cdi","/var/run/cdi"]
    EOF

    Now we need to verify podman can utilize our GPUs. Again we are running these commands on both our GPU enabled servers.

        podman run --rm --device nvidia.com/gpu=all docker.io/nvidia/cuda:12.0.0-base-ubuntu22.04 nvidia-smi -L
    GPU 0: Tesla T4 (UUID: GPU-9491a3e6-ea29-ba4e-4403-083244d5575c)
    GPU 1: Tesla T4 (UUID: GPU-1d877ac8-5df1-34b0-4f86-59945e37d2ba)


    DCGM install on RHEL 10

    The install is pretty straight forward, for this post I am performing these steps on both my GPU enabled hosts.

    Add Nvidia Repo

    Note that I could not find DCGM in the RHEL10 repos, so going with RHEL9 repos. Seems to work without issue thus far.

    # dnf config-manager --add-repo \
    https://developer.download.nvidia.com/compute/cuda/repos/rhel9/x86_64/cuda-rhel9.repo

    Now install as shown below.

    Note we are skipping the gpgcheck due to RHEL10 newer OpenGPG verification stack. Since this is a lab, and not production, this is acceptable for testing.

    # dnf install -y --nogpgcheck datacenter-gpu-manager-4-core datacenter-gpu-manager-4-proprietary

    Now we can start the service.

    # systemctl enable --now nvidia-dcgm

    And we check that the service is running.

    systemctl status nvidia-dcgm
    ● nvidia-dcgm.service - NVIDIA DCGM service
    Loaded: loaded (/usr/lib/systemd/system/nvidia-dcgm.service; enabled; preset: disabled)
    Active: active (running) since Tue 2026-02-24 10:37:35 EST; 36min ago
    Invocation: da9cd3a2c8a5463a95a3605b68adf253
    Main PID: 2263 (nv-hostengine)
    Tasks: 17 (limit: 1646190)
    Memory: 91.7M (peak: 93.1M)
    CPU: 23.253s
    CGroup: /system.slice/nvidia-dcgm.service
    └─2263 /usr/bin/nv-hostengine -n --service-account nvidia-dcgm
    Feb 24 10:37:35 prometheus.lab systemd[1]: Started nvidia-dcgm.service - NVIDIA DCGM service.
    Feb 24 10:37:37 prometheus.lab nv-hostengine[2263]: DCGM initialized
    Feb 24 10:37:37 prometheus.lab nv-hostengine[2263]: Started host engine version 4.5.2 using port number:>

    dcgmi discovery -l

    Now that dcgmi is installed lets confirm it can see our GPUs.

    This command lists all discovered GPUs. Shows GPU id, PCI BUS ID and Model Name. Should be comparable to the output of nvidia-smi. This command confirms that dcgmi can talk to the host engine.

    dcgmi discovery -l
    2 GPUs found (Active).
    +--------+----------------------------------------------------------------------+
    | GPU ID | Device Information |
    +--------+----------------------------------------------------------------------+
    | 0 | Name: Tesla T4 |
    | | PCI Bus ID: 00000000:04:00.0 |
    | | Device UUID: GPU-9491a3e6-ea29-ba4e-4403-083244d5575c |
    +--------+----------------------------------------------------------------------+
    | 1 | Name: Tesla T4 |
    | | PCI Bus ID: 00000000:06:00.0 |
    | | Device UUID: GPU-1d877ac8-5df1-34b0-4f86-59945e37d2ba |
    +--------+----------------------------------------------------------------------+

    Enable Health Watches

    Health Watches are background checks that DCGM performs on the GPU subsystems. While they are not required for metrics export they do provide additional metrics related to GPU health, so lets enable them.

    dcgmi health -s a
    Health monitor systems set successfully.

    dcgm-exporter

    NVIDIA DCGM Exporter is an open-source tool (container) that collects real-time telemetry data from NVIDIA GPUs—such as utilization, memory usage, temperature, and power consumption—and exposes them in a Prometheus-compatible format.

    We are going to run it via Quadlet ( /etc/containers/systemd/dcgm-exporter.container)

    [Unit]
    Description=NVIDIA DCGM Exporter
    After=network-online.target nvidia-dcgm.service
    Wants=network-online.target
    [Container]
    Image=docker.io/nvidia/dcgm-exporter:latest
    Network=host
    SecurityLabelDisable=true
    AddCapability=SYS_ADMIN
    PodmanArgs=–device nvidia.com/gpu=all
    PodmanArgs=–pid=host
    [Service]
    Restart=always
    [Install]
    WantedBy=multi-user.target
    view raw gistfile1.txt hosted with ❤ by GitHub

    Now lets start the container

     sudo systemctl daemon-reload
    [root@columbia ~]# sudo systemctl start dcgm-exporter.service
    [root@columbia ~]# podman ps
    CONTAINER ID  IMAGE                                  COMMAND     CREATED         STATUS         PORTS       NAMES
    8804d788f7f5  docker.io/nvidia/dcgm-exporter:latest              10 seconds ago  Up 10 seconds              systemd-dcgm-exporter


    Lets verify it is listening on port 9400.

    ss -tnlp | grep 9400
    LISTEN 0 4096 *:9400 *:* users:(("dcgm-exporter",pid=135704,fd=24))

    Now lets poke a hole in our firewall to allow the traffic.

    firewall-cmd --add-port=9400/tcp --permanent
    success
    [root@prometheus ~]$ sudo firewall-cmd --reload

    And test locally with curl.

    curl -s -o /dev/null -w "%{http_code}" http://10.1.10.23:9400/metrics

    We can also view the metrics in our browser

    Screenshot of a command-line output displaying NVIDIA GPU statistics including clock frequency, temperature, power usage, and memory utilization.

    Next steps will be to scrape and import.
    Which I will do after lunch.

    Resources

    Learn more from NVIDIA’s official resources:

  • Dell iDRAC Service Module on RHEL 10.1

    Dell iDRAC Service Module on RHEL 10.1

    The Dell iDRAC Service Module (ISM) is a tool that can be used for better integration between the Dell iDRAC and a running OS. It can provide additional monitoring and metrics to Idrac by brigding the gap between the OS and the underlying Dell hardware.

    iSM collects data from both the operating system and hardware and merges them into the iDRAC Lifecycle Log for consolidated monitoring.


    Downloading

    I used this link to download for RHEL.

    I then scp’d the gzipped tarball to the target system


    Installation on RHEL

    There are not currently packages for RHEL 10, so I went with the RHEL 9 packages. You will need to install 2 rpms from the tarball. First start with the dcism-ocs rpm.

    # dnf -y install ./dcism-osc-7.0.1.0-123.rpm
    

    Next install the dcism rpm.

    # dnf -y install ./dcism-5.0.1.0-2951.el9.x86_64.rpm
    

    I expect that if I was running a recognized OS, such as RHEL 9, I could have used the script setup.sh to install the rpms in the proper order.

    Start the Service

    Use the command below to start/restart the service

    # systemctl restart dcismeng.service

    Checking the output of “ip a” you will see a new interface that I assume is used to communicate back and forth between the OS and the iDRAC.

    12: idrac: <BROADCAST,MULTICAST,UP,LOWER_UP> mtu 1500 qdisc fq_codel state UP group default qlen 1000
        link/ether ec:2a:72:01:5b:5b brd ff:ff:ff:ff:ff:ff
        altname enp0s20f0u14u3
        altname enxec2a72015b5b
        inet 169.254.1.2/16 brd 169.254.255.255 scope global idrac
           valid_lft forever preferred_lft forever
    

    Enabling Features

    Now that the iDRAC service module is installed we can now run setup.sh should be able to enable and disable features. Note that I did not have much luck in this area, as I was running into issues with missing files which was probably due to the fact that I installed the rpms manually. Either way, you can see what is enabled by default.

    Available features are shown below.

    OS Information via iDRAC

    Now that the service is running and able to communicate with the iDRAC, I can see the following OS level info after logging into the iDRAC


    Additional Resources

    Being new to the iDRAC service module I will link to some relevant documentation which details features, functionality, and configuration.

    RESOURCEURL
    S.M.A.R.T monitoringhttps://www.dell.com/support/manuals/en-ca/idrac-service-module/ism_4.0.1_user_guide/s.m.a.r.t-monitoring?guid=guid-90e39801-c990-43ea-b4a5-4ec0027c019e&lang=en-us
    Configuring iDRAC Service Module from the iDRAC web interface
    https://www.dell.com/support/manuals/en-ca/idrac-service-module/ism_4.0.1_user_guide/configuring-idrac-service-module-from-the-idrac-web-interface?guid=guid-7ca252a8-5491-4637-90b0-2d4b747185b6&lang=en-us

  • Getting Started with Instructlab: Installing on Fedora 40

    Getting Started with Instructlab: Installing on Fedora 40

    Prerequisite – Install python 3.11. The default on Fedora 40 is python 3.12

    $ sudo dnf -y install python3.11.x86_64 python3.11-devel.x86_64  -y

    Install automake and gcc (GNU Compiler Collection)

    $ sudo dnf install make automake gcc gcc-c++
    

    Add the following env vars to your .bashrc, and source

    export CUDA_HOME=/usr/local/cuda
    export PATH=${CUDA_HOME}/bin:${PATH}
    export LD_LIBRARY_PATH=${CUDA_HOME}/lib64:$LD_LIBRARY_PATH
    

    Create your virtual env and activate

    $ python3.11 -m venv --upgrade-deps venv
    $ source venv/bin/activate
    

    Note that every time you want to use instructlab cli (ilab) post-install you must source the file above. venv/bin/activate

    We then run the 3 commands shown below. Apparently there is a known bug and we will not pick up these required packages as needed, so we need to install them manually.

    $ pip install --upgrade pip wheel setuptools
    $ pip install torch
    $ pip install flash-attn

    The install guide found here has you run this command to clear out the pip package cache (for this one package. Not required for first install, but may be on subsequent runs.

    $ pip cache remove llama_cpp_python

    Now install instructlab

    $ pip install 'instructlab[cuda]' -C cmake.args="-DLLAMA_CUDA=on" -C cmake.args="-DLLAMA_NATIVE=off" 

    Install vllm.

    NOTE: The vllm install is currently failing with this error – ImportError: libcudnn.so.8: cannot open shared object file: No such file or directory. I am looking to find a resolution or work-around

    $ pip install vllm@git+https://github.com/opendatahub-io/vllm@2024.08.01

    Resources

    1. https://docs.instructlab.ai/getting-started/linux_nvidia/
    2. https://github.com/vllm-project/vllm
    3. https://www.redhat.com/en/topics/ai/what-is-vllm
    4. https://github.com/opendatahub-io

  • Homelab: Shushing a loud Dell Server.

    Homelab: Shushing a loud Dell Server.

    Rack mount servers are notoriously loud. They are designed to run in data centers which and not next to your head. In a data center no one really notices or cares if a machine’s fans are spinning faster than they need to. 2RU Servers are bad, but 1U are even worse as the smaller the fan the faster they need to spin to move air. Start plugging certified PCI cards into slots and things only get worse. This is exactly my experience with 2 nvidia Tesla T4s in my “used-to-be” quiet Dell T620 (Idrac 7)

    Note: Passing fan overrides to the idrac does not survive a reboot/restart and fans won’t spint up if temps rise. See https://github.com/christopherpaquin/Dell-Server-Fan-Shusher for a better solution (GPU aware).

    So lets learn to control the noise a bit.

    First off you need to enable IPMI over Idrac. In Idrac7 (and Idrac8), log into the web interface, and navigate to IDRAC Settings > Network. Scroll down to IPMI Settings, and make sure that “Enable IPMI Over LAN” is checked. This will allow you to ssh to the idrac and run IPMI commands.

    Installing IPMI tool

    You will first need to install ipmitool on your workstation.

    $ apt install ipmitool -y

    Manual Fan Control

    Run the command below to turn on manual control over the fans. You need to do this before you can change their speeds.

    ipmitool -I lanplus -H $IP -U $USER -P $PASS raw 0x30 0x30 0x01 0x00
    

    If you want to turn off manual control, and return to auto control, you can run the command below

    ipmitool -I lanplus -H $IP -U $USER -P $PASS raw 0x30 0x30 0x01 0x01
    

    Finding your Fans

    Run the command below to find our how may system fans you have as well as their numbering

    $ ipmitool -I lanplus -H 10.1.10.13 -U root -P calvin sdr list | grep Fan
    Fan1             | 1440 RPM          | ok
    Fan2             | 1200 RPM          | ok
    Fan3             | disabled          | ns
    Fan4             | disabled          | ns
    Fan5             | disabled          | ns
    Fan6             | disabled          | ns
    Fan Redundancy   | Not Readable      | ns
    

    Run the command below to set all fans at 40% speed.

    1. 0xff is all fans,
    2. 0x26 is approx 40% (scale is from 0 to 64)
    $ ipmitool -I lanplus -H $IP -U $USER -P $PASS raw 0x30 0x30 0x02 0xff 0x26

    Check the results.

    $ ipmitool -I lanplus -H 10.1.10.13 -U root -P calvin sdr list | egrep -i fan[1,2]
    Fan1             | 2400 RPM          | ok
    Fan2             | 2040 RPM          | ok
    

    You can also target individual fans. In the example below we will increase fan1 to 100%. Where…

    1. 0x02 is fan1
    2. 0x64 is 100%
    $  ipmitool -I lanplus -H 10.1.10.13 -U root -P calvin raw 0x30 0x30 0x02 0x01 0x64

    Lets do the same for fan1 (0x00 is fan1)

    $ ipmitool -I lanplus -H 10.1.10.13 -U root -P calvin raw 0x30 0x30 0x02 0x00 0x64

    Now lets bring both fans back to about 40%

    The one-liner below will show you temps as you want to make sure nothing gets too hot.

    $ ipmitool -I lanplus -H 10.1.10.13 -U root -P calvin sdr list | grep Temp
    Inlet Temp       | 20 degrees C      | ok
    Temp             | 30 degrees C      | ok
    Temp             | 25 degrees C      | ok
    

    Additional Tools

    Here are a few tools that I have found in my travels

    1. Dell IDRAC Fan Controller Docker – is a docker container that allows you to control fan speeds. Have not tried it but looks pretty simple to use.
    2. R710 Fan Control
    3. Fan Control and Monitoring Script
    4. IDRAC Fan Control
    5. Server Manager